- Exploring
Data:
Describing
patterns and departures from patterns. Exploratory
analysis of data makes use of graphical and numerical
techniques to study patterns and departures from patterns. Emphasis
should be placed on interpreting information from graphical and
numerical displays and summaries.
- Constructing and
interpreting
graphical displays of
distributions of univariate data (dotplot, stemplot, histogram,
cumulative frequency plot)
- Constructing and
interpreting
graphical displays of
distributions of univariate data (dotplot, stemplot, histogram,
cumulative frequency plot)
- Summarizing distributions
of
univariate data
- Comparing
distributions
of univariate data (dotplots,
back-to-back stemplots, parallel
boxplots)
- Exploring bivariate data
- Exploring categorical data
- Frequency
tables and bar charts
- Marginal and joint frequencies for two-way tables
- Conditional relative frequencies and association
- Comparing distributions using bar charts
- Sampling
and Experimentation:
Planning and conducting a study:
Data must be collected according to a well-developed plan if valid
information on a conjecture is to be obtained. This plan includes
clarifying the question and deciding upon a method of data collection
and analysis.
- Overview of methods
of data collection
- Planning and conducting
surveys
- Planning and conducting
experiments
- Generalizability of
results
and types of conclusions that
can be drawn from observational studies, experiments, and surveys
- Anticipating
Patterns: Exploring
random phenomena using
probability and simulation: Probability is the tool used for
anticipating what the distribution of data should look like under a
given model.
- Statistical
Inference:
Estimating population parameters and
testing hypotheses: Statistical inference guides the selection
of
appropriate models.
|

SOCR
Navigators
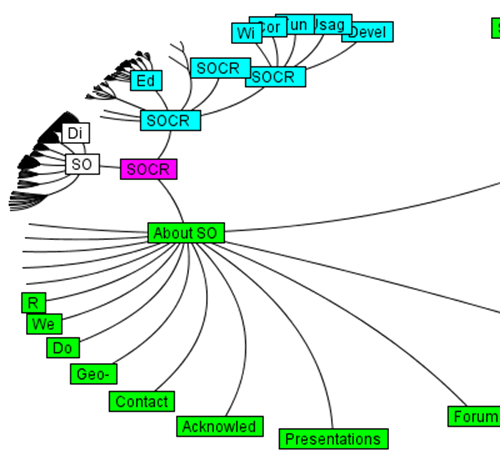
SOCR Interactive Viewer
(Java)

Hyperbolic Wheel Viewer
(Java)

SOCR
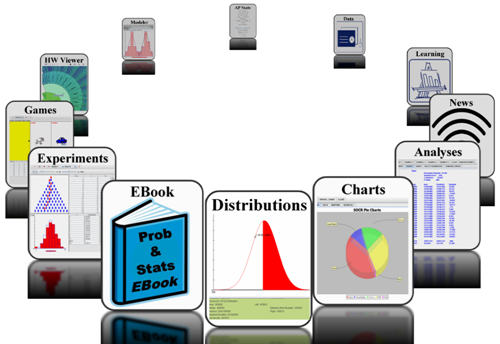
3D Carousel Viewer (Flash)

Keyword
Search
 |


